Skip to content
Home
News
What is Maths Week England?
2026 Resources and Events
Resource Archive
Speaker Directory
About us
Our Aims
Meet The Maths Week England Committee
Why Maths Week England? (a personal story)
Frequently Asked Questions
Partner With Us
Privacy Policy
Safeguarding Policy
Code of Conduct
Our Supporters
Menu
Home
News
What is Maths Week England?
2026 Resources and Events
Resource Archive
Speaker Directory
About us
Our Aims
Meet The Maths Week England Committee
Why Maths Week England? (a personal story)
Frequently Asked Questions
Partner With Us
Privacy Policy
Safeguarding Policy
Code of Conduct
Our Supporters
Search
Search
Register free
for Maths Week England 2026!
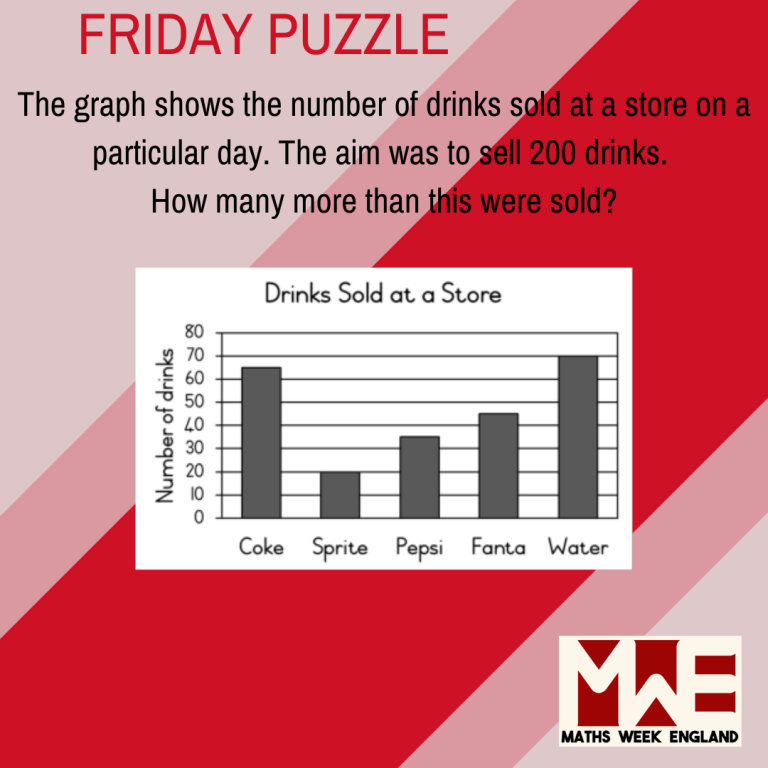
2024 Daily Puzzles - Friday - Key Stage 1